
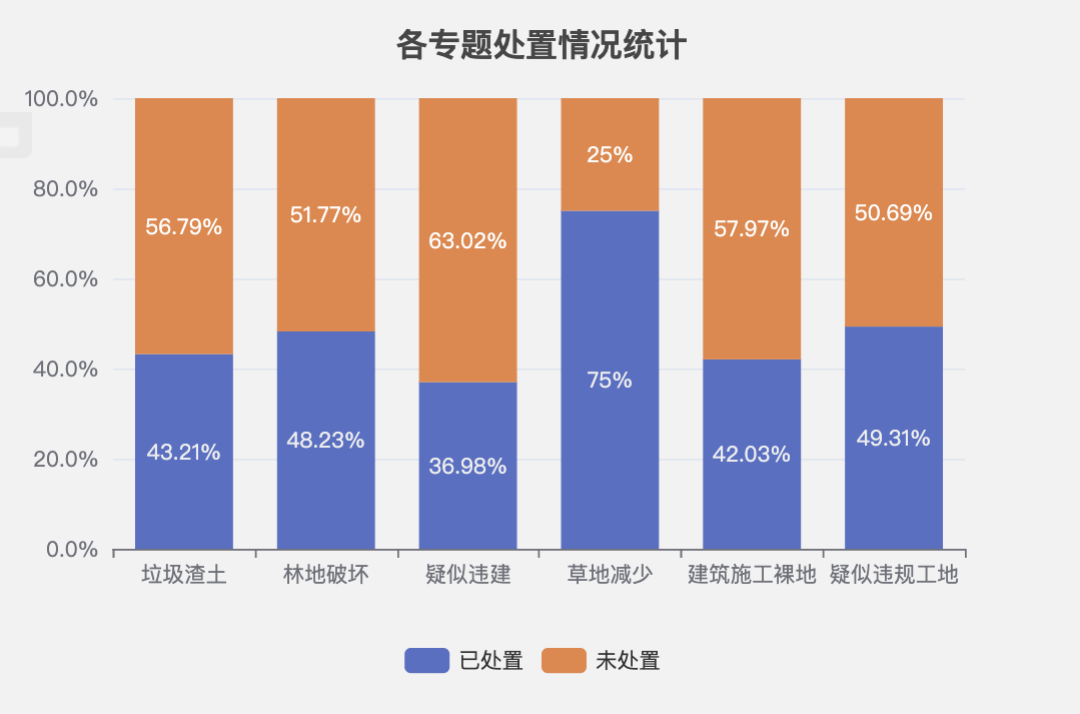
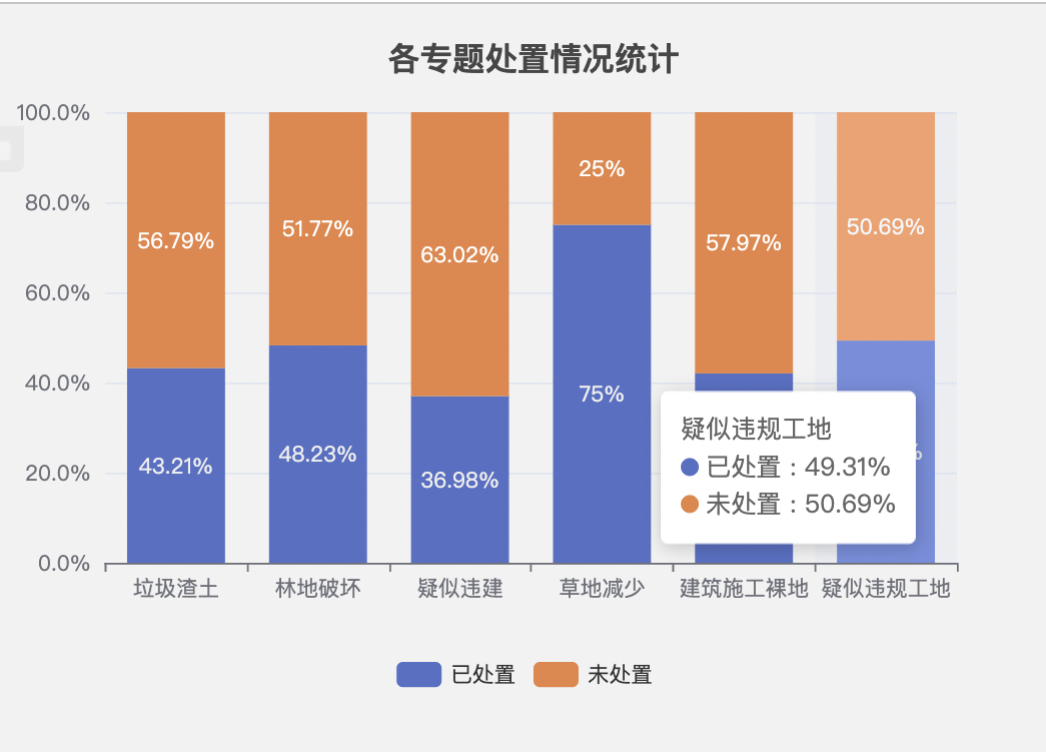
1、效果


2、jsp
<%@ page language="java" contentType="text/html; charset=UTF-8" pageEncoding="UTF-8"%><% String path = request.getContextPath();%><!DOCTYPE HTML><html xmlns="http://www.w3.org/1999/xhtml"><head> <title>案件推送列表</title> <jsp:include page="/page/hcbh/api/module.jsp"></jsp:include> <script type="text/javascript" src="<%=path %>/page/hcbh/api/taskpush/stats/echarts-5.3.1.js"></script> <script type="text/javascript" src="<%=path %>/page/hcbh/api/taskpush/stats/zhzx.js"></script></head><body><%-- <div id="status" style="width: 600px;height:400px;"></div>--%> <div id="zt" style="width: 600px;height:400px;"></div></body>3、javascript
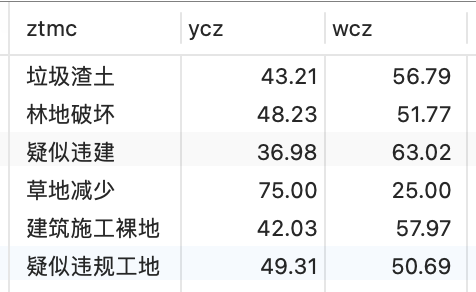
$(document).ready(function() { stats_zt();});/** * 按专题统计 */function stats_zt(){ var url = "/gds/query/list.do"; var data = { "c":"stats_ztmc" }; var res = ajaxData(url,data); // 基于准备好的dom,初始化echarts实例 var myChart = echarts.init(document.getElementById('zt')); if(res.length === 0){ //无数据展示 myChart.setOption({ title: { text: '暂无数据', x: 'center', y: 'center', textStyle: { color: '#65ABE7', fontWeight: 'normal', fontSize: 16 } } }); }else{ var dataAxis = []; //X轴name var dataYcz = []; //y轴-已处置 var dataWcz = [];//y轴-未处置 for (var i in res) { dataAxis.push(res[i].ztmc); dataYcz.push(res[i].ycz); dataWcz.push(res[i].wcz) } //绘制图表 myChart.setOption({ title:{ text: '各专题处置情况统计', textAlign:'center', top:'4%', left:'50%' }, tooltip: { trigger: 'axis', axisPointer: { type: 'shadow' }, formatter: function (params) { var relVal = params[0].name; for (var i = 0, l = params.length; i < l; i++) { relVal += '<br/>' + params[i].marker + params[i].seriesName + ' : ' + params[i].value + '%' } return relVal; } }, legend: { top:'90%' //图例置底 }, grid: { left: '3%', containLabel: true }, xAxis: [ { type: 'category', axisLabel: {//x轴文字的配置 show: true, interval: 0,//使x轴文字显示全 }, data: dataAxis } ], yAxis: [ { type: 'value', axisLabel: { show: true, interval: 'auto', formatter: '{value}.0%' }, show: true } ], series: [ { name: '已处置', type: 'bar', stack: 'Ad', emphasis: { focus: 'series' }, label:{ show:true, formatter:function(params){ return params.value+'%'; } }, data:dataYcz }, { name: '未处置', type: 'bar', stack: 'Ad', emphasis: { focus: 'series' }, label:{ show:true, color:'#fff', formatter:function(params){ return params.value+'%'; } }, itemStyle:{ //修改柱状图颜色 normal:{ color:'#E98344' } }, data: dataWcz } ] }); } window.onresize = myChart.resize;}4、数据
版权声明:本文内容由互联网用户自发贡献,该文观点仅代表作者本人。本站仅提供信息存储空间服务,不拥有所有权,不承担相关法律责任。如发现本站有涉嫌侵权/违法违规的内容, 请发送邮件至 举报,一经查实,本站将立刻删除。
文章由极客之音整理,本文链接:https://www.bmabk.com/index.php/post/117263.html

